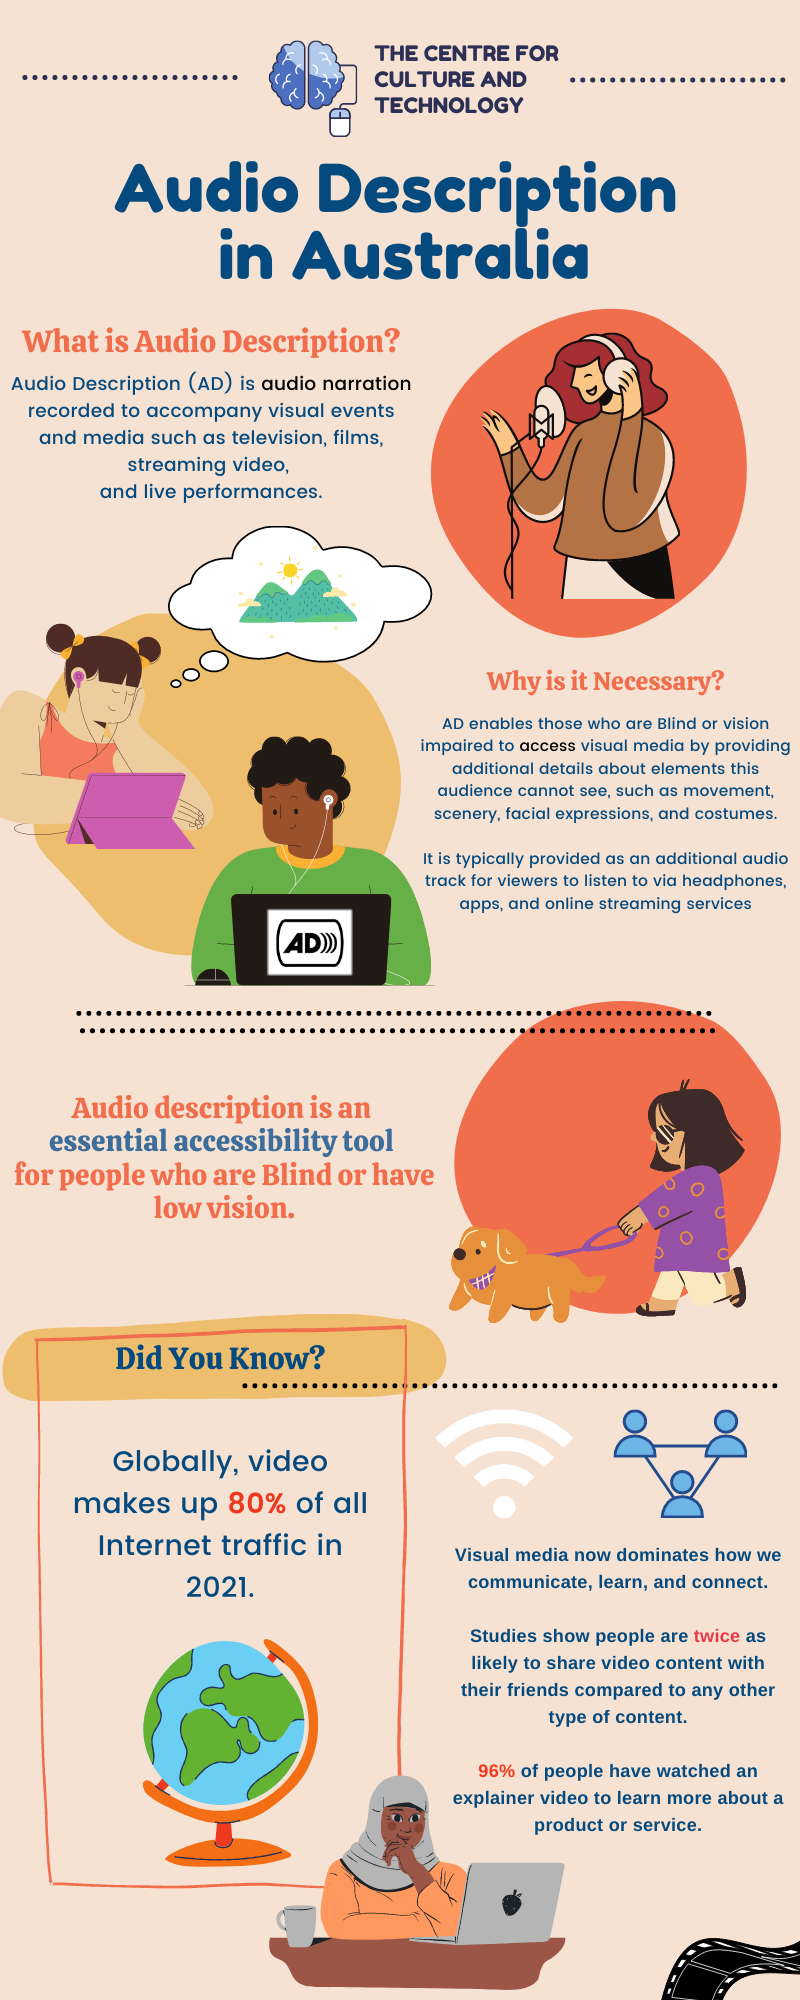
In the Curtin disability research team, we sometimes use infographics and comics to help raise public awareness and understanding of our work and the assistive features we advocate for. These will periodically be shared on this blog, starting with the one below – which was created to draw more attention to audio description.
Note: all 4 sections of the infographic are accompanied by alt text.
![Infographic page 2. A montage of colourful images depict people listening to headphones, watching television, and campaigning for AD. Image text: In order to participate fully in Australian society and culture, all people must have equal access to visual media, both online and offline. This has become even more important since the start of the COVID-19 pandemic. Did you know? According to Article 27 of The Universal Declaration of Human Rights: "Everyone has the right freely to participate in the cultural life of the community [and] to enjoy the arts." Additionally, Article 21 of the UN Convention on the Rights of Persons with Disabilities states that people with disabilities must be provided access to information on "an equal basis with others" through the provision of "accessible formats and technologies." Audio description is not a bonus or luxury, but a basic human right for people with vision impairment. Is it available in Australia? The campaign for audio description in Australia has been ongoing for nearly 30 years. AD is increasingly available on DVDs, in cinemas, at cultural events and subscription video on demand. However, television has lagged behind. Until 2020, Australia was the only English-speaking OECD country in the world that did not require its broadcasters or streaming services to provide audio description.](https://audiodescriptionau.com.au/wp-content/uploads/2021/07/2.png)
REFERENCES
- Blind Citizens Australia – https://www.bca.org.au/adontv/
- CISCO – https://www.cisco.com/c/dam/m/en_us/solutions/service-provider/vni-forecast-highlights/pdf/Global_2021_Forecast_Highlights.pdf
- Wordstream – https://www.wordstream.com/blog/ws/2017/03/08/video-marketing-statistics
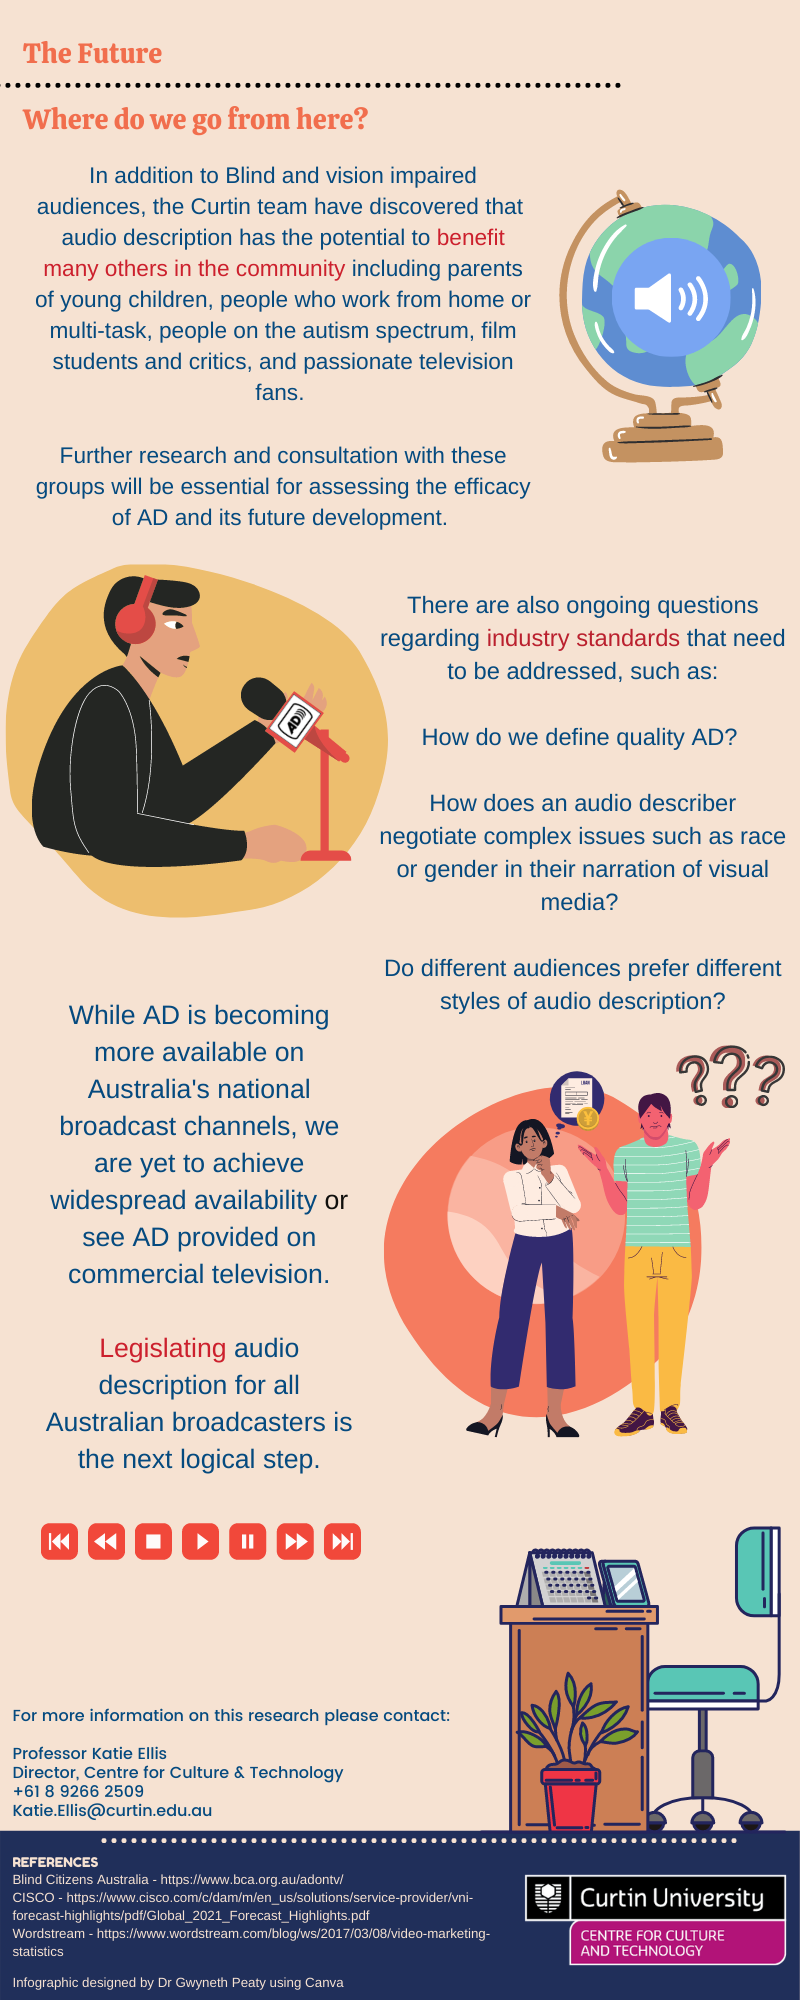
For more information on this research please contact:
Professor Katie Ellis: katie.ellis@curtin.edu.au
Infographic designed by Dr Gwyneth Peaty using Canva.